1 Chalkboard
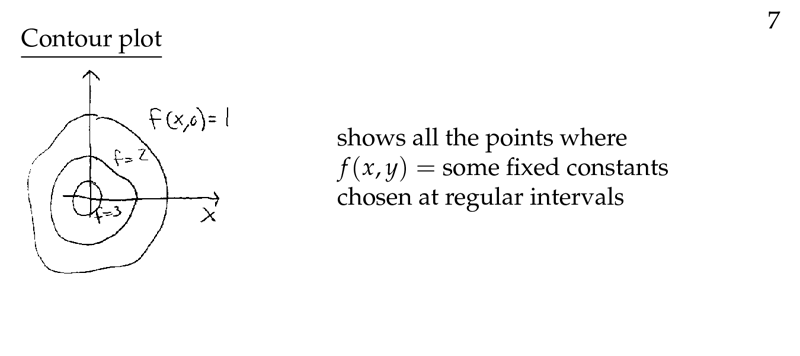
Figure 1: Contour plot definition
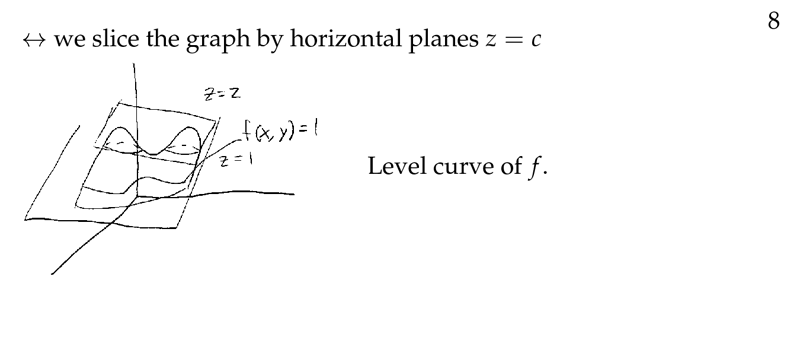
Figure 2: Level of contour plot
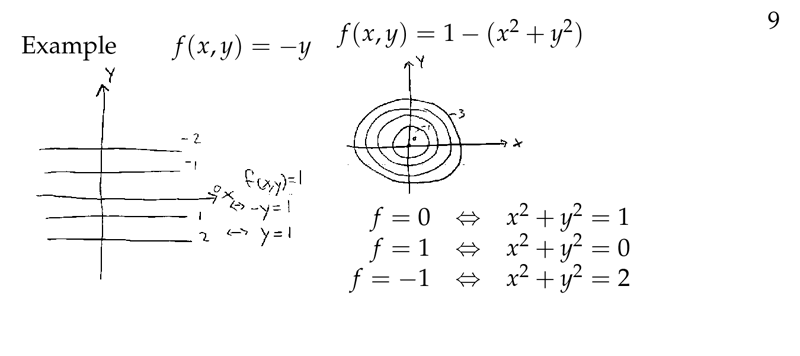
Figure 3: Contour plot examples
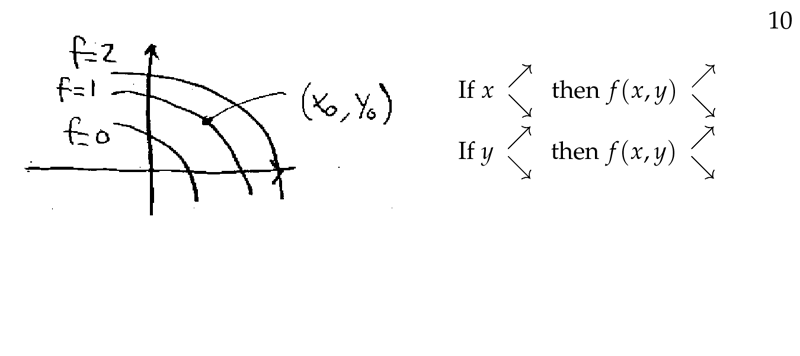
Figure 4: Contour plot guide
2 What is a contour plot?
2.1 Front
What is a contour plot?
2.2 Back
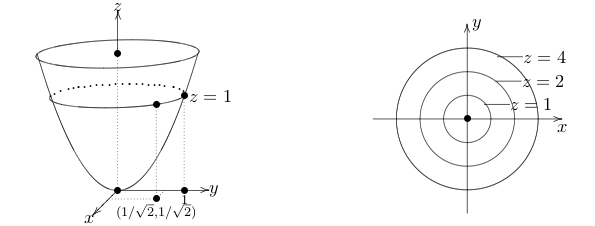
It’s another way of visualizing functions of two variables. It’s as topographic map. It’s called ‘Level curves map’ too.
Each level curve represent the same value for different independent inputs