1 Chalkboard
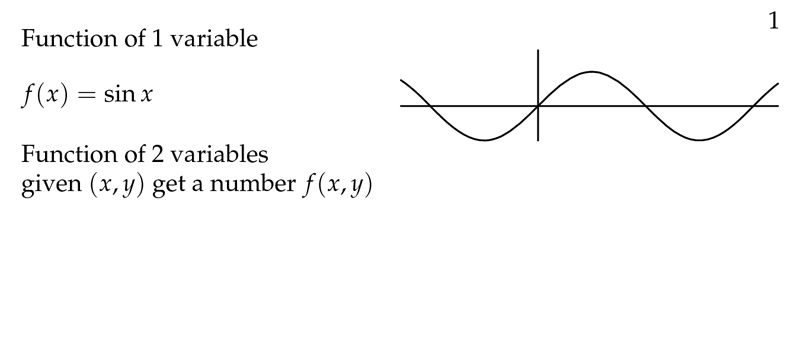
Figure 1: Function of 1 variable
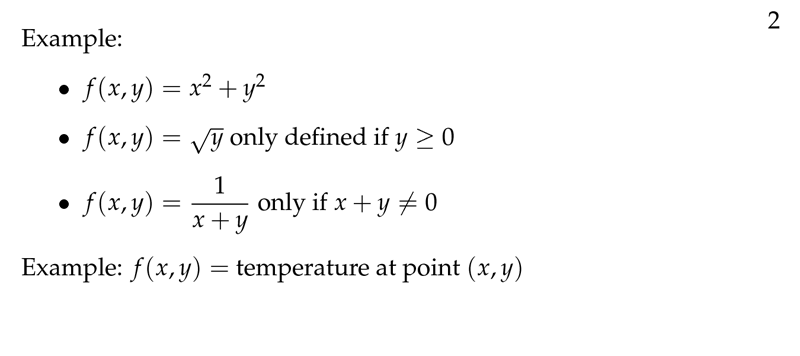
Figure 2: Example of multivariable functions
Figure 3: For simplicity, functions based on 2 or 3 variables
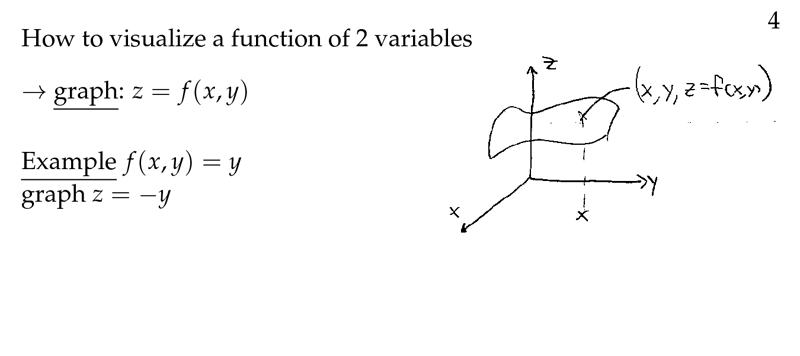
Figure 4: Visualize a function of 2 variables
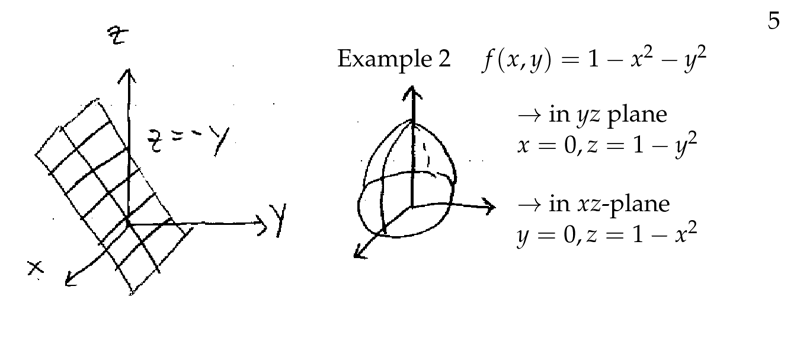
Figure 5: Example of a graph of a two variables function
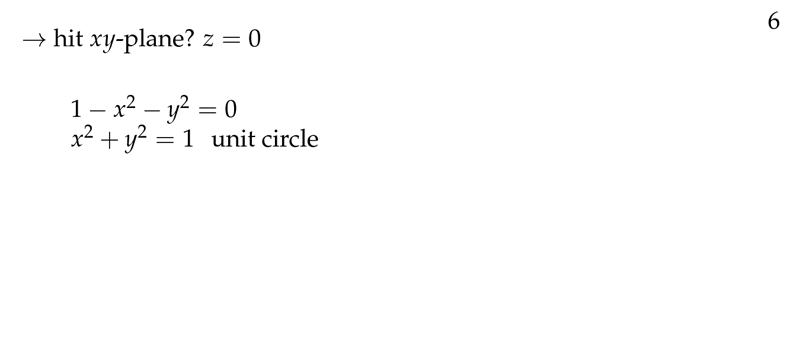
Figure 6: When the graph hit the plane \(xy\text{-plane}\)
2 What is a dependent and independent variables in a function?
2.1 Front
What is a dependent and independent variables in a function?
\(z = f(x,y)\)
2.2 Back
\(x,y\) are independent variables and \(z\) is a dependent variable. \(x,y\) variables can take any value and \(z\) depends on these values.
Be careful with domain definition of the function
3 How many dimensions do you need to graph a 2 variable function?
3.1 Front
How many dimensions do you need to graph a 2 variable function?
3.2 Back
We need 3 dimensions, 2 independent and 1 depends
\(z = f(x,y)\)
4 How to graph a 2 variables functions?
4.1 Front
How to graph a 2 variables functions?
4.2 Back
- Draw the axes, usually you can draw with the eye somewhere in the first octant
- Set \(x=a\) constant, usually \(x=0\), and draw the \(yz\text{-plane}\), at least 3 planes
- Set \(y=a\) constant, usually \(y=0\), and draw the \(xz\text{-plane}\) at least 3 planes
- Maybe you need more traces at several planes. You should expect to do a certain amount of trial and error.